Create your first automation in just a few minutes.Try Studio Web →
Kibana Plug-In Dashboards for UiPath
by Remus Andrei Pirvu
0
Tool
<100
Summary
Summary
Execution, Operations, and Queue Transaction Kibana Dashboard
Overview
Overview
Three basic Kibana Dashboards (Execution, Operations, and Queue Transaction) Metrics with single click Install Utility Tool that helps you get started with UiPath Dashboards
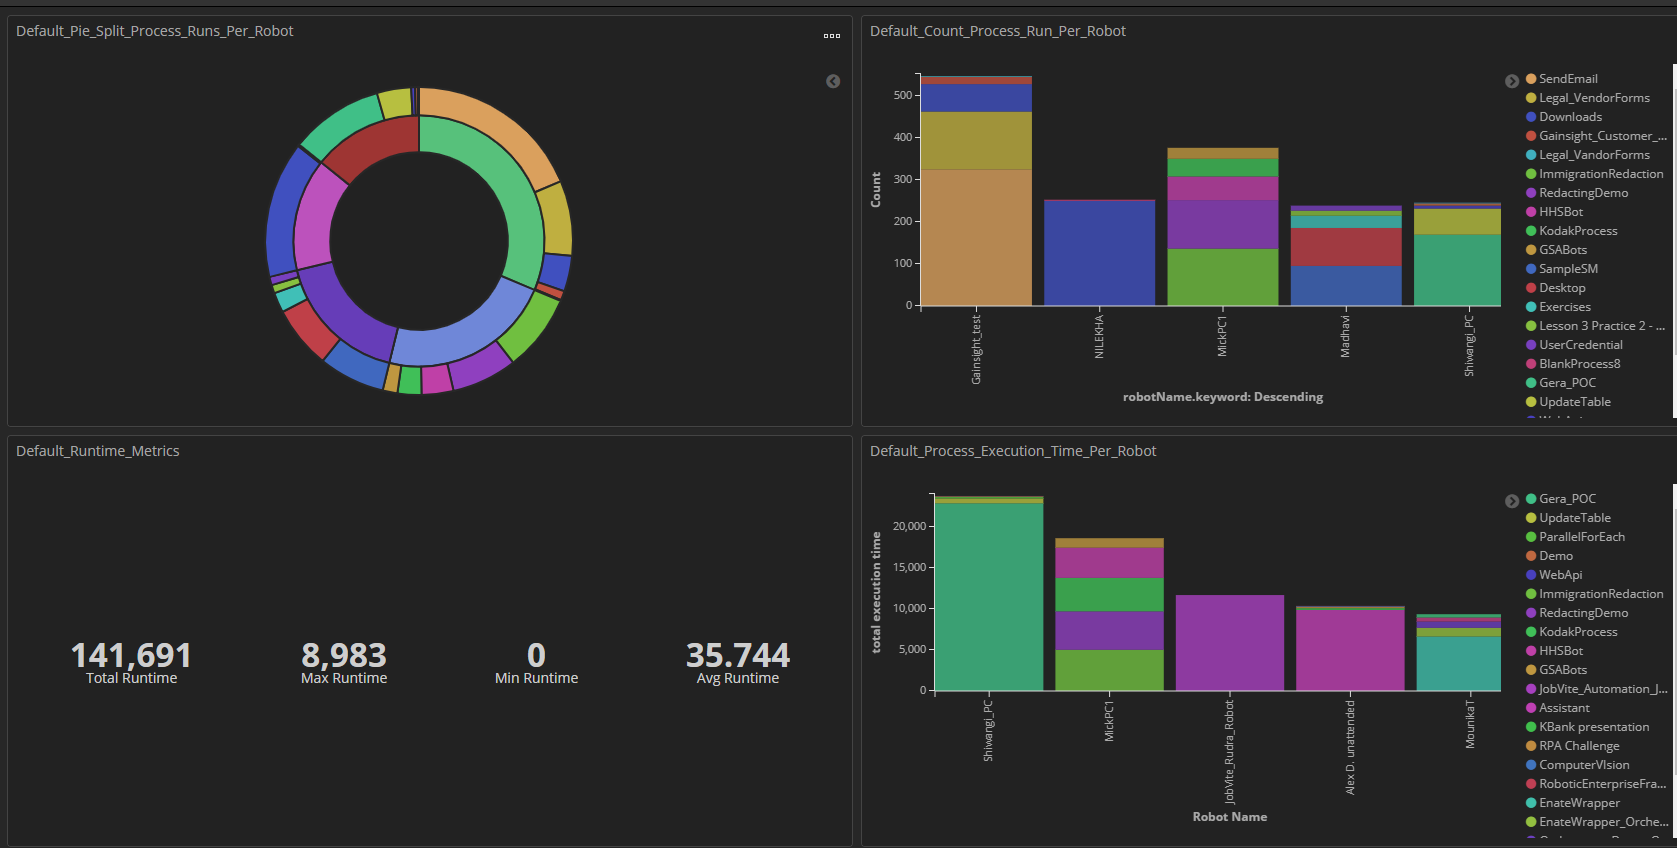
These three Dashboards provide 14 visualisations combined:
- Operational_Metrics : Provides 4 visualisations:
- Default_Pie_Split_Process_Runs_Per_Robot: Helps Visualise all the process run divided across the robots.
- Default_Count_Process_Run_Per_Robot: Helps visualise the robots running split by processes
Features
Features
This caters to the need of organisations wishing to start with Basic Monitoring right away. The three dashboards cover the basic monitoring visualisation covering all the fundamental components of UiPath and Runtime behaviour of the processes. Moreover, the utility tool, KibanaImporter, assists you to get it done easily.
Additional Information
Additional Information
Dependencies
Kibana 6.x and above are needed in order to use this dashboard
License & Privacy
MIT
Privacy Terms
Technical
Version
1Updated
January 31, 2020Works with
UiPath 2018.4. All previous versions are supported for this dashboard
Certification
Silver Certified
Tags
Collections
Support
UiPath Community Support
